Tapati Mukhopadhyay
MUMBAI, the financial, commercial and entertainment nerve centre of India, has been under serious distress because of the COVID-19 pandemic.
Mumbai generates 33 per cent of the country’s income tax, 60 per cent of custom duty, 20 per cent of central excise duty, and 40 per cent of the foreign trade, 25 per cent of industrial output, 70 per cent of capital formation, 10 per cent of factory employment. The city is one of the top 10 centres of global financial flow, contributing over 6 per cent of India’s GDP. Large numbers of financial institutions have their head office in Mumbai
Mumbai recorded its first two cases of Coronavirus infection on March 11, 2020. Five days later the number moved up to 14 in the city and suburbs, and since then the number of infected cases have been moving up at a galloping speed. By May 6, total number of affected cases in the country moved exponentially up to 49,391 cases, with 1,694 deaths. For Maharashtra, the numbers were 15,525 (over one third of India) and 617, respectively. Mumbai recorded on this date 9,758 cases (about 63 per cent share of Maharashtra), with 387 deaths.
Mumbai is the most attractive place for seeking opportunity and employment for the rest of the country. The city has a large catchment area --from the north-east to the southernmost` tip of the country. The rapid spread of Coronavirus cases in Mumbai is therefore a matter of great concern.
Mumbai is a unique city, insular in shape, with eccentric location of the city centre at the southern tip of the island. The original nucleus of the population was in the south, within the Fort wall. All further development happened in phases towards the north. The straight-line distance from the city centre up to the end of the present municipal boundary at Dahisar is as long as 50 km.
The area of the city was 62.7 sq km in 1946; it increased to 430 sq km at present, a growth of seven times in a period of over seven decades.
In 1881, population of Mumbai was 7.7 lakh; the number moved up to 3 million at the time of Independence of India. After almost a quarter century in 1971, the number moved up to 5.9 million. In 1991, it became 9.8 million and further to 12.7 million in 2011. Population of Greater Mumbai is as high as 20 million at present.
The city of Mumbai is divided into three segments, the island city, the western and the eastern suburbs. In the Island city (comprising of 9 wards), population density was 49,348 persons per sq km, according the 2011Census.
According to the Census 2011, nine wards of Mumbai island city was inhabited by 24.8 per cent total population, while the suburbs accounted for the remaining 75.25 population. Almost half of the city’s population live in highly congested slum areas, both the worst polluted age-old slum areas, as well as somewhat less polluted new slum areas. The non- availability of space is the key factor in determining the quality of life of the city.
The burgeoning growth of population of Mumbai was accompanied by a growing population living in slum areas. While in the municipal wards of the island city (wards A,B,D, E, F/S and G/S) have about 16.52 per cent of total slum population of Mumbai, the Census reports show that two wards (F/N and G/N), have the highest percentage of slum population.
In western suburb of Mumbai, the slum population of Wards H/E, H/W, K/E, K/WR/C, R/N and R/S is around 54.26 per cent, while those of wards L, M/E, M/W, N, S and T of Mumbai’s eastern suburb had a slum population of 45.74 per cent.
Slums of Mumbai are densely populated filled with narrow and dirty alleys, open sewers filled with trash. Living in such deplorable condition makes the life of slum dwellers highly vulnerable and prone to infection of any type, not to speak of the deadly Covid-19. Living in a high density areas one infected person can spread the killer disease to many and many more in turn.
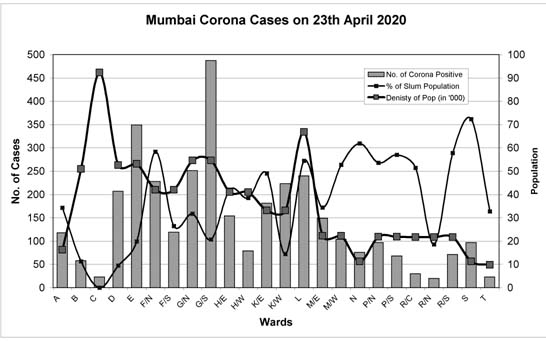
The graph below shows the ward-wise distribution of slum population, population density and its relationship with the concentration of Coronavirus cases. Wards have been arranged from south to north of the city as the original city centre is located at the southern tip of the island of Mumbai.
Notes: The release of ward-wise distribution of Coronavirus data has been stopped by BMC from April 25, according to press report. As such, latest numbers of cases could not be plotted. Latest demographic data largely based on Census 2011.
Some explanations about the graph will be pertinent. Illustratively, Ward A is constituted by Colaba, Cuffe Parade and Fort. Fort is the administrative headquarter of the city, the original nucleus. Outside the fort and towards the south, there has been a proliferation slum beyond the newly developed Nariman Point, touching Sasson dock area. Part of this area is inhabited by the Kolis, the original inhabitants of Mumbai. The residential population of the old Fort area declined as it has been replaced by commercial function; the area has a slum population of 34 per cent and population density of 16,229 per sq km. This area registered 118 Coronavirus affected cases out of 3,452 total cases in Mumbai as on April 25 as shown in the graph above.
Next to the ward A is the ward B, known as Big Bazar of Mumbai, starting from Masjid ending in Dana Bunder, the whole sale market of food grains. The wholesale market has been shifted to New Mumbai. Many warehouses are still located here. The area is dilapidated and ‘locked’. Residential population has moved out. Slum dwellers live in make-shift shanty town; constitute over 11 per cent of population. The density of population of the ward is 50,916. B ward recorded 58 Coronavirus cases.
Ward C is the extension of Bazar, but largely, this is not a slum area. In the west side of ward C is Marine Drive with large open ground, gymkhana, etc. But this area recoded a very high population density, as high 92,312. Ward D covers Malabar Hill area, the rich peoples’ residential area.
On the eastern side is Grant Road station area, a low lying reclaimed land –always gets waterlogged in monsoon. About 10 per cent of population of this area is slum dwellers. E ward lies between Grant Road and Mahalaxmi, the border zone of the erstwhile textile industrial belt. On the eastern side of Mahalaxmi is Madanpura, a highly congested slum area, with a slum population of 20 per cent and a density of 50,916. D ward recorded 207 Coronavirus cases.
Wards F/N and F/S on the eastern side are characterized by old and obsolete small docks. Over 58% of population of ward F/N and 26 per cent of ward F/S are slum population. These two has a high 58% slum population, and a density of population of these two is 41,981. Number of Corona virus cases in these two wards are 347.
Ward G/S, i.e., Worli, Pravadevi, Lower Parel, etc., having 21 per cent slum population; registered 487 cases. Ward G/N, i.e., Dadar, Mahim & Dharavi, with 32 per cent slum population, registered 251 cases.
This is the old city and the suburb, divided by Mahim creek, low lying and swampy, mangrove area – locating Asia’s largest slum, Dharavi, which comes under G/N. It occupies 2.1 sq km in area inhabiting a large population of 700,000, with a high density of 277,136. It is one of the most densely populated areas of the world. As on May 5, 2020, Dharavi recorded 33 new cases and 20 deaths, taking the total number of affected coronavirus cases to 665. Number of infected cases in Dharavi has been growing rapidly. It has become an epicenter of Coronavirus cases in Mumbai.
Incidentally, Dharavi slum was founded in 1884 during the British period; it grew largely because of the closures of factories, expulsion of people from the peninsular city centre by the colonial government as well as migration of rural population from rural areas to Mumbai city. It is a highly polluted area, with unplanned mixed residential and commercial land use functions, tannery and chemicals industries. Population of Dharavi is multi-lingual, multi- ethnic, multi-cultural. They are enterprising people, involved in as high as $ 1billion business annually.
At present, Dharavi slum along with the slums in H/E ward i.e., Bandra east, Vakola, Kalanagar, Santacruz East including Beharmpur, Khetwadi, etc., combined with ward H/W constitute slum population of over 42 per cent, with a density of 40,987. These areas are now the hot spot of coronavirus pandemic. These areas registered 181 cases.
Most of the wards in the eastern suburb like L, M, W, N, S – Kurla, Chembur, Bhandup, Mulund have high slum population, varying between 52 per cent and 72 per cent, with a density varying from 11,243 ( near Powai) to 66,831( Kurla). In these wards, 517 cases have been recorded.
To conclude, Coronavirus cases in Mumbai have been moving up from 526 on April 6 to 9,758 cases on May 6, a growth on almost 19 times during one month. Number of death in the city has moved up during this period from 34 to 387, a growth of over 11 times. How these numbers will move in the immediate future is predictable.
The lockdown continues and most probably, in Mumbai it will continue beyond May 17. While the COVID19 cases have been growing at exponential rate, the economic condition of the vast majority population of the city has already become extremely critical. It is a challenging time for all of us living in the city in general and the government of Maharashtra along with BMC and other related authorities in particular.


